What this is. A snapshot of the Grafana dashboard for a Go-based LLM inference gateway I built. The gateway sits in front of multiple model providers (mock, xAI, Ollama), routes requests with a cost-optimized strategy, caches responses in Redis, wraps each provider in a circuit breaker, and serves a small RAG pipeline on top of pgvector.
What you're looking at. ~800 requests fired against the local stack over two minutes. Metrics are scraped by Prometheus and visualized in Grafana. Traces go to Jaeger (not shown). Everything runs from a single docker compose up.
Stack. Go · chi · Prometheus client_golang · OpenTelemetry · Grafana · Jaeger · Redis · Postgres+pgvector · Ollama.
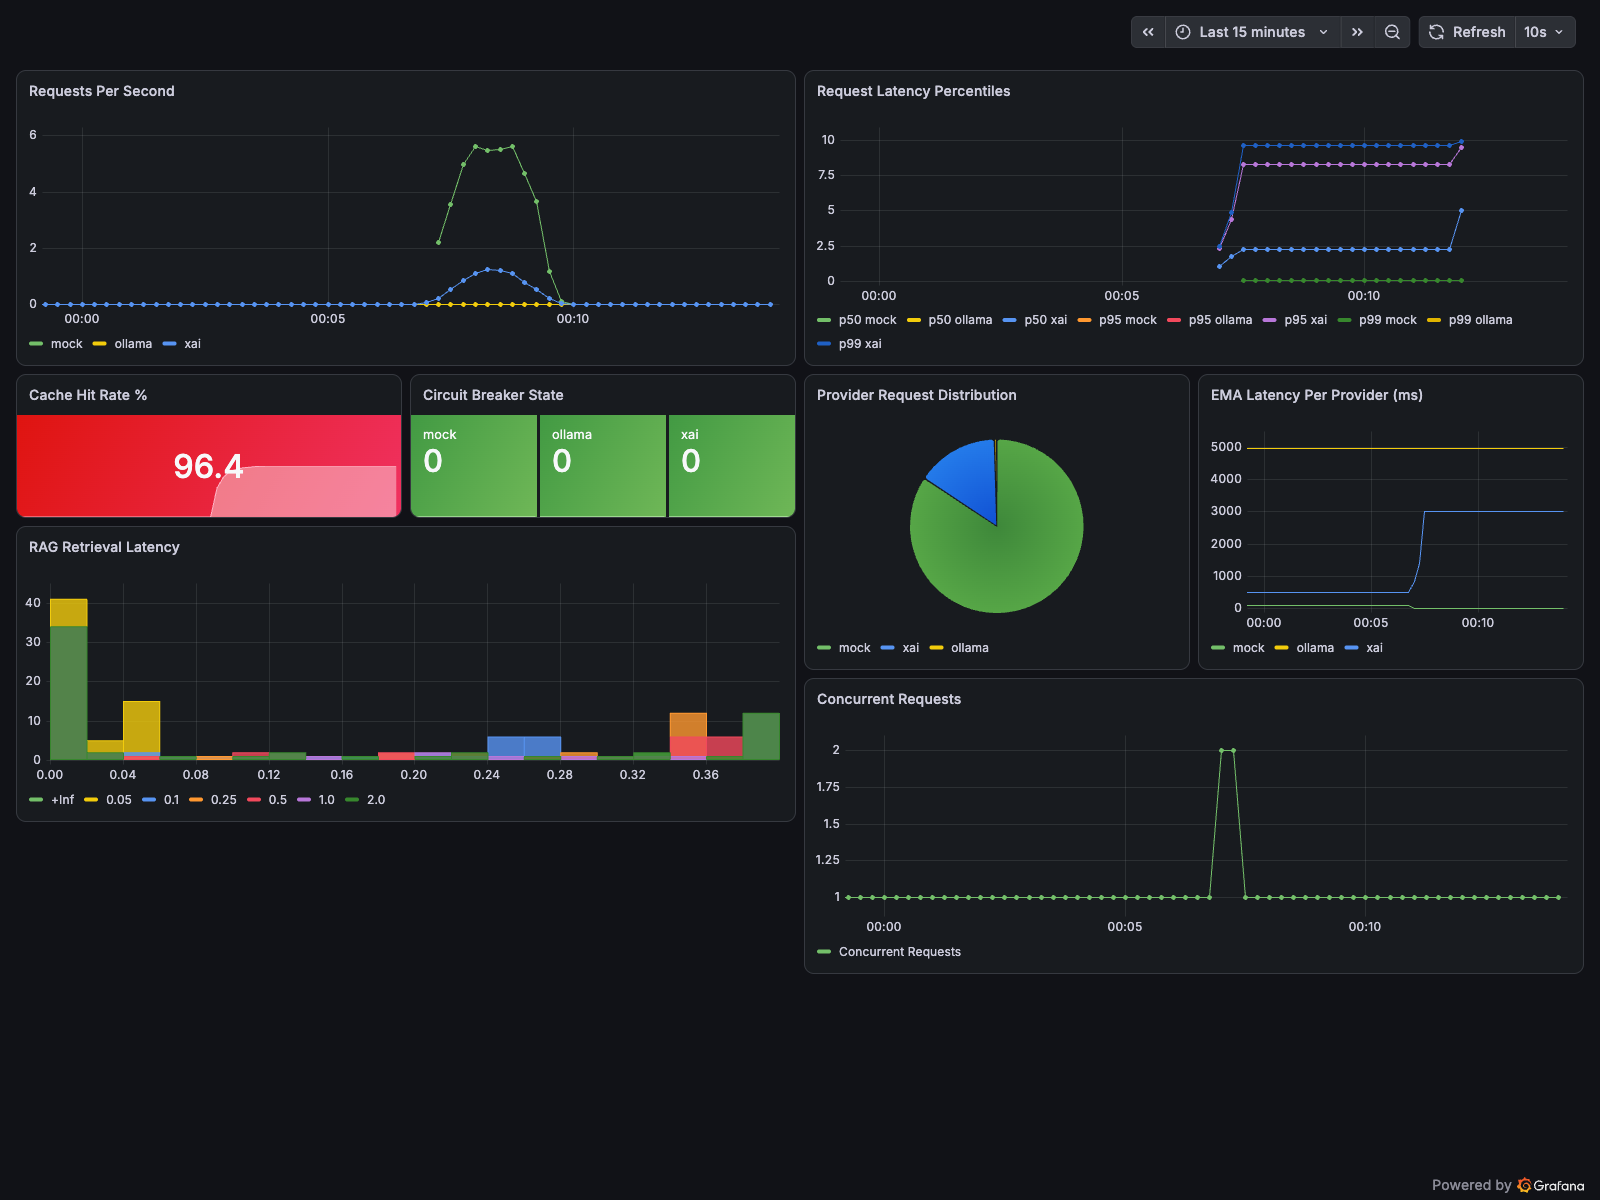
Eight panels: request rate, latency percentiles per provider, cache hit rate, circuit-breaker state, provider distribution, EMA latency, RAG retrieval histogram, and concurrent request depth.
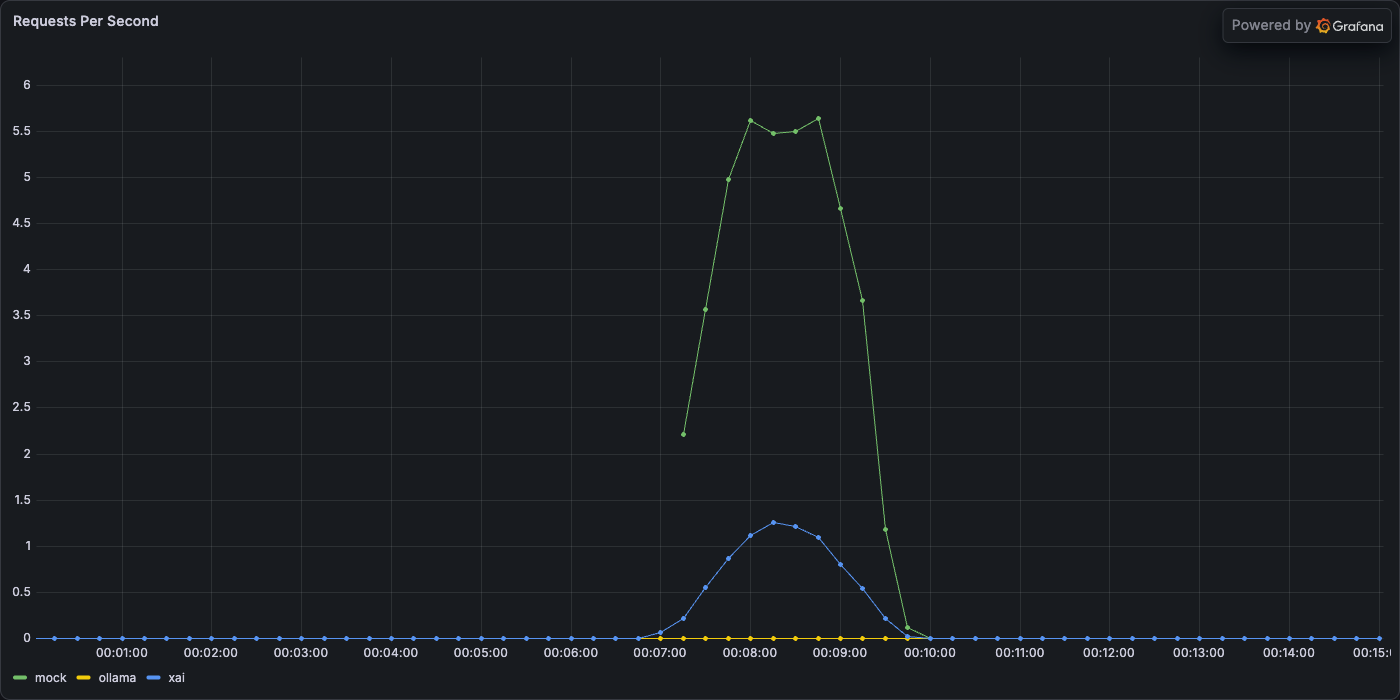
RPS per provider during the 2-minute load test. Mock provider peaks near 5.6 req/s (routed most traffic under the cost-optimized strategy); xAI handles the long tail; Ollama stays quiet because its EMA latency (~5s) makes it uncompetitive.
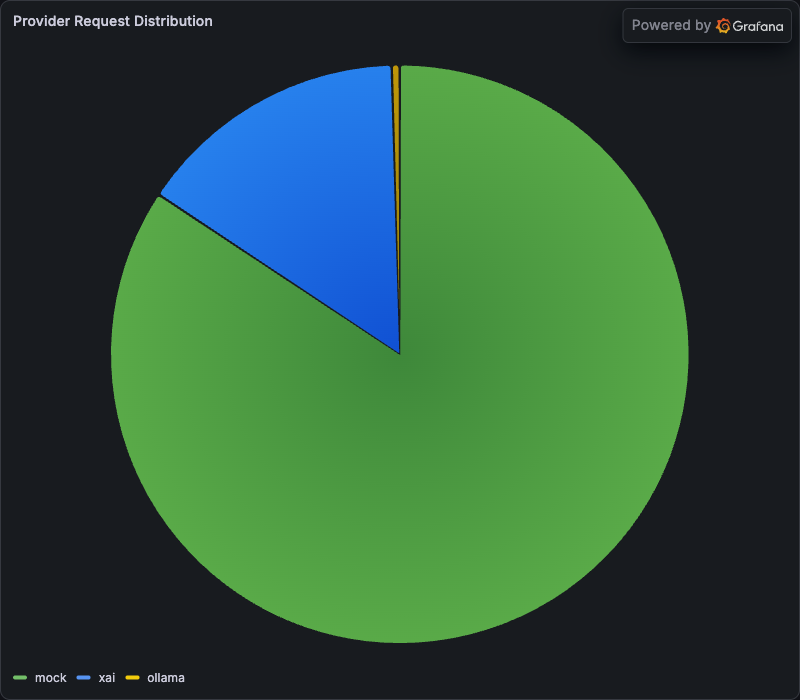
Cost-optimized routing sends the bulk of traffic to the cheapest healthy provider (mock), a slice to xAI, and effectively zero to Ollama once its observed latency pushes it out of contention. Swap the strategy env var and this pie redistributes.
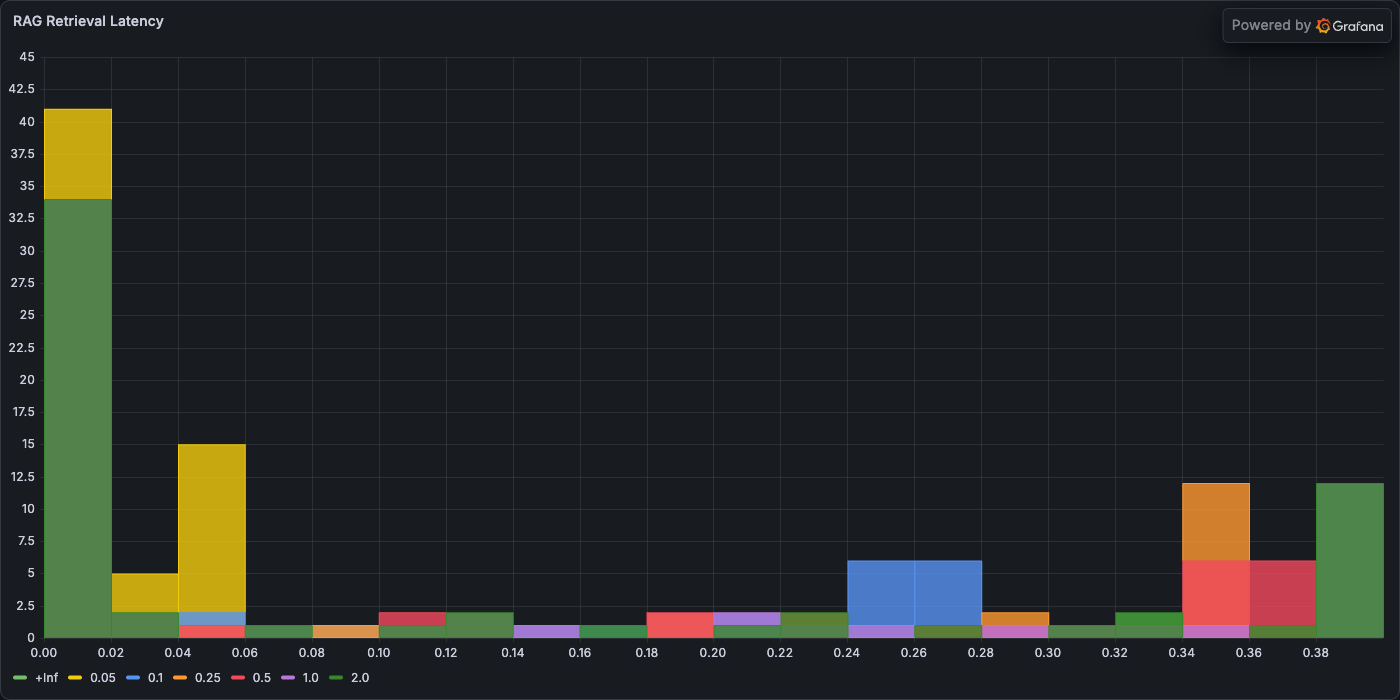
RAG retrieval-stage latency, bucketed. Most queries return in under 60 ms (pgvector on warm cache). The long tail past 300 ms is cold-embedding regenerations via the Ollama nomic-embed-text model.